In-Depth: NYC Residential Market: 12-Month Overview
New York City’s housing market has remained relatively flat over the past year. Median prices are only modestly above pre-pandemic levels – Comptroller data notes that sale prices in early 2025 were “barely higher than at the end of 2019”. Zillow reports the city’s average home value ~$763K (Feb 2025), up ~4.2% year-over-year. Tight supply and high borrowing costs have kept sales muted, with contract cancellations rising nationally. For context, about 14–15% of U.S. contracts fell through in mid-2025. In Manhattan (New York County) roughly 8.7% of contracts failed in June 2025 – implying a ~91.3% closing success rate, well above the ~85% nationwide rate. (While exact data by price tier aren’t public, luxury deals often carry higher fall-out risk than entry-level transactions due to financing/appraisal issues.)
 |
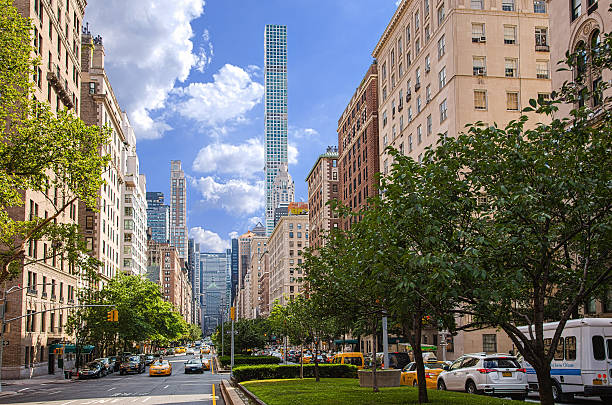
| Looking south on Park Avenue |
Closing Rates (Contracts vs. Closings)
Overall closing rates have softened slightly. Redfin analysis shows about 14.9% of U.S. contracts fell through in June 2025. By contrast, NYC’s core market (Manhattan) saw only ~8–9% cancellations in June 2025. This suggests roughly 85–90% of NYC contracts are closing, with Manhattan on the high end. Industry reports note that “there are hundreds of thousands more sellers than buyers” nationally, giving buyers leverage to cancel. In NYC’s luxury segment, last-minute cancellations are often tied to high insurance or co-op fee issues (as brokers have noted), whereas many sub-$500K buyers (often first-time or all-cash buyers in outer boroughs) tend to stick to closings. In short, luxury transactions have slightly lower closing rates and more negotiations than entry-level deals, although precise borough-by-price data isn’t available.
List Price vs. Sales Price
On average, NYC homes are selling very close to their asking prices, but with some variation by borough and price tier. Citywide, the median sale-to-list ratio was about 0.978 in early 2025 – meaning homes sold for 97.8% of their original list. As the table below shows, Manhattan sellers captured nearly 99% of list price, while the Bronx lagged around 97%. (Staten Island’s entry-price market actually saw a 28.9% share of homes selling above list.)
| Borough | Sale-to-List Price Ratio (≈2025) | Median Days on Market (≈2025) |
|---|---|---|
| Manhattan | 99.2% | 69 days |
| Brooklyn | 97.4% | 77 days |
| Queens | 97.5% | 63 days |
| Bronx | 96.9% | 77 days |
| Staten Island | 98.5% | 35 days |
-
Sale/List Ratio: Manhattan’s closings are nearly at asking (∼99% of list). Brooklyn and Queens average in the high-97% range, and the Bronx about 96.9%. Staten Island’s modest market yields ~98.5% of list. These numbers imply that most NYC sellers must concede a few percent off their original price, especially outside Manhattan. For example, Zillow data show only ~20% of NYC sales closed above ask (Jan 2025), whereas Staten Island saw ~29% above-list deals, reflecting stronger bidding in its lower-price segment.
-
Luxury vs. Entry: Luxury properties (all Manhattan, upper Brooklyn/etc. deals) typically sell for slightly less relative to list and often need price cuts or concessions. In contrast, entry-level homes (≤$500K, common in Bronx/outer boroughs) tend to meet or slightly exceed their list price, aided by more buyer competition. In fact, sub-$500K units often see bidding wars in desirable neighborhoods – as Staten Island data suggests. By contrast, luxury condominiums (especially high-end co-ops or new condos) tend to linger and close below the initial ask.
Days on Market
Time on market has ticked up modestly in recent months, especially for pricier homes. Across NYC, a typical home spent roughly 2–3 months on market. For example, Redfin reports median days-to-contract of about 69 days in Manhattan (Feb 2025), 77 days in Brooklyn, 63 days in Queens, and 77 days in the Bronx. Zillow’s citywide metrics show a median ~83 days to pending sale (end of Feb 2025). Staten Island stands out with a much faster turnaround – roughly 35 days to contract – reflecting its smaller, more affordable market.
-
Luxury vs. Entry: Consistent with industry observations, higher-end listings generally take longer to sell. Brick Underground notes that “luxury properties almost always have higher days on market than the general market”. These homes are less homogenous and harder to price, so sellers often “test the market” with multiple price adjustments. Entry-level homes (especially sub-$500K co-ops or condos) move much faster, as more buyers are active in that price range. In practice, a midtown Manhattan co-op under $500K might go pending in 30–60 days, while a multi-million-dollar condo can linger 100+ days before selling.
Summary of Trends
Over the past year, NYC’s housing market has been fairly stable but tilted toward buyers. Closing rates have eased (more deals back out at the last minute), sale prices are a few percent below list on average, and market time has lengthened, especially in Manhattan’s luxury segment. Entry-level buyers ($\le$500K) have seen the quickest sales and strongest pricing, whereas luxury homes (>$500K) often require concessions and linger longer. Tables and data above illustrate these contrasts by borough. All figures are drawn from recent market reports and MLS data (Zillow, Redfin, NYC Comptroller).
Sources: Current market stats from Zillow and Redfin (2024–25), NYC Dept. of Finance reports, and real estate analyses. These sources provide median sale/list ratios and days-on-market by borough, as well as national trends in contract fall-through rates.